
Insights from BV4's startup database – Product
Defining the valuation of a startup is a difficult task for various reasons and one noteworthy factor that differentiates this task from traditional valuation approaches of established companies, is the missing historic financial traction.
At an early stage, it is important to assess startups from a qualitative aspect instead of a purely quantitative one (DCF approach or using multiples). BV4 is specialized in the assessment of startups across several stages and frequently assesses early-stage ventures and their qualitative characteristics.
In this series of articles, we will take a look at different data-driven insights that BV4 gathered from startups in 2021. In the first part of this article, we will have a look at the BV4 model and explain what it is and how it measures the qualitative aspects of a startup. In the second part, we will show one important data pattern from our model regarding one of the dimensions that are assessed by the BV4 model.
BV4 built a qualitative scorecard model, which focuses specifically on such qualitative aspects (e.g., team complementarity, previous founding experience, development stage, scalability potential or the go-to-market strategy of startup). Thus far, BV4 has scouted over 13'000 startups of which more than 3'000 were assessed. Over 200 parameters have been considered to perform the assessments to obtain the scores in four distinct dimensions: product, business model, team, and market. BV4 assesses several qualitative parameters within each dimension. The following graph shows some parameters of the BV4 model:
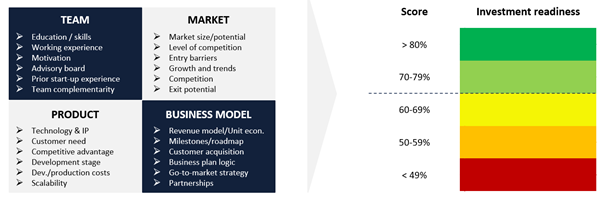
The result is a score which represents the risk profile of the startup at its current stage. The colored rating scale on the right side shows that a high score indicates that the startup is an attractive case for the average investor. Startups should achieve a higher score over time as their products get closer to the market and they gain more traction, clarity on the business model as well as important target clients.
In this article, we will focus on the following dimension: product. In the following analysis, we will dive into one important data pattern which was derived by evaluating the different startups in the data base:
Startups in our database show a strong negative correlation between the level of technology (which measures how easily the solution can be copied and the IP protection) and its scalability potential. The negative correlation means that (on average) startups with a strong IP are usually less scalable compared to startups that do not have a highly complex technology or a strong IP protection in place. One reason could be that startups, which have a rather complex underlying technology, are either hardware focused (which limits the scalability compared to the average software solution) or if they have software solutions, face significant implementation costs for new clients (which are comprised of long set-up processes and potential demands for further customizations). This is especially the case for certain EnterpriseTech solutions.
It is important to understand that the data sample consists of 356 startups of which the majority operates in the field of Med/HealthTech, FinTech, EnterpriseTech and DeepTech, which can have an impact on the observed results. The startups were mainly operating in the Pre-Seed and Seed stage. While the data sample represents only a fraction of the overall ecosystem, it already gives insights into some points that founders should consider when building their ventures.
In the next series of articles we will show the most important data patterns derived from the other dimensions: the market, team and the business model.